
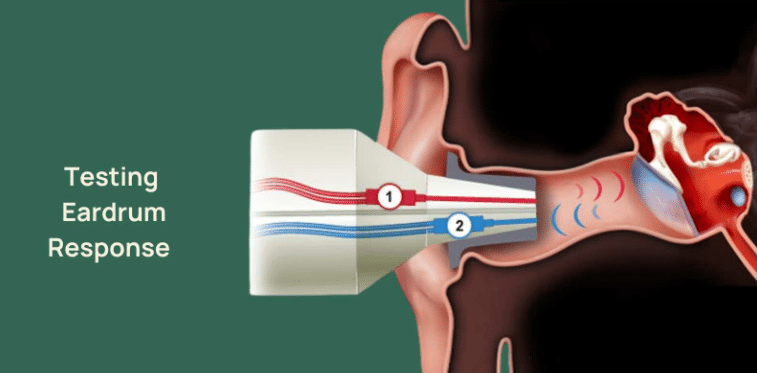
When you have a tympanometry test, the machine produces a graph called a tympanogram. You may be told that the tracing looks like Type A, B or C. These names describe patterns of eardrum movement and middle-ear pressure; they are not diagnoses on their own.
Here is a simple guide to what the patterns can suggest and why clinicians interpret the graph alongside your symptoms, ear examination and hearing tests. For an introduction to how the procedure works, read our guide to tympanometry.
What does a tympanogram measure?
A small probe gently seals the ear canal, produces a quiet test sound and changes the air pressure. The equipment measures how the eardrum and middle-ear system respond. The graph can help assess eardrum mobility and pressure, although it does not measure hearing sensitivity directly.
A clinician also considers the measured ear-canal volume and other values. This is particularly important if the graph is flat or the readings appear unusual.
Type A tympanogram: A clear peak
A Type A curve has a recognisable peak in the expected pressure range. It is usually consistent with typical middle-ear pressure and eardrum movement. A Type A result does not, however, rule out every hearing problem or every middle-ear condition.
Some tracings are described as Type As (a relatively shallow peak) or Type Ad (an unusually tall peak). Their significance depends on the full examination, not simply the letter on the graph.
Type B tympanogram: A relatively flat tracing
A Type B tracing has no clear peak. Possible reasons include middle-ear fluid, a blocked probe, significant ear wax, or a perforated eardrum, depending on the measured ear-canal volume and other findings. It would be misleading to say that Type B always means fluid or infection.
Your clinician may recommend further examination, audiometry or medical review if the findings and symptoms warrant it.
Type C tympanogram: A peak at negative pressure
A Type C tracing peaks at a more negative pressure than expected. It can be associated with Eustachian-tube dysfunction or changes in middle-ear ventilation, including during or after a cold. Its significance varies, and it does not automatically require treatment.
Quick comparison
| Result | Typical appearance | Possible interpretation |
|---|---|---|
| Type A | Peak in expected pressure range | Often typical middle-ear mobility |
| Type B | Flat or nearly flat curve | Several possibilities; ear-canal volume and examination are essential |
| Type C | Peak at negative pressure | May reflect negative middle-ear pressure |
Does tympanometry tell me whether I have hearing loss?
Not by itself. Tympanometry assesses middle-ear mechanics; a hearing assessment can measure hearing thresholds and may include other clinically appropriate tests. The results work together to build a more complete picture.
What happens at Wigan Hearing?
Our independent clinic in Standish offers tympanometry as part of suitable ear-health and hearing assessments. Where clinically appropriate, we include it free with ear wax removal. We explain the result and can email you a digital copy of your tympanogram, so you have a record of the middle-ear measurement to keep.
The test is brief and non-invasive. You may notice a temporary pressure change inside the ear, but it should not normally be painful. If we find something that needs medical assessment, we will explain the next step rather than diagnose solely from a graph.
When should I seek further advice?
Persistent one-sided symptoms, pain, discharge or worsening hearing merit assessment. Sudden hearing loss requires urgent medical review and should not wait for a routine tympanometry appointment. If you are unsure whether a hearing assessment or ear wax appointment is appropriate, please call the clinic first.
Where can I ask about my results?
For questions about tympanometry or hearing assessment, contact Wigan Hearing or call 01257 444044. For information about our service prices, see the relevant appointment page rather than booking a different treatment type.